Google Column Chart Using Codeigniter
Google Column Chart
You might know that Google chart basically displays different statistical data on different chart types such as column chart,
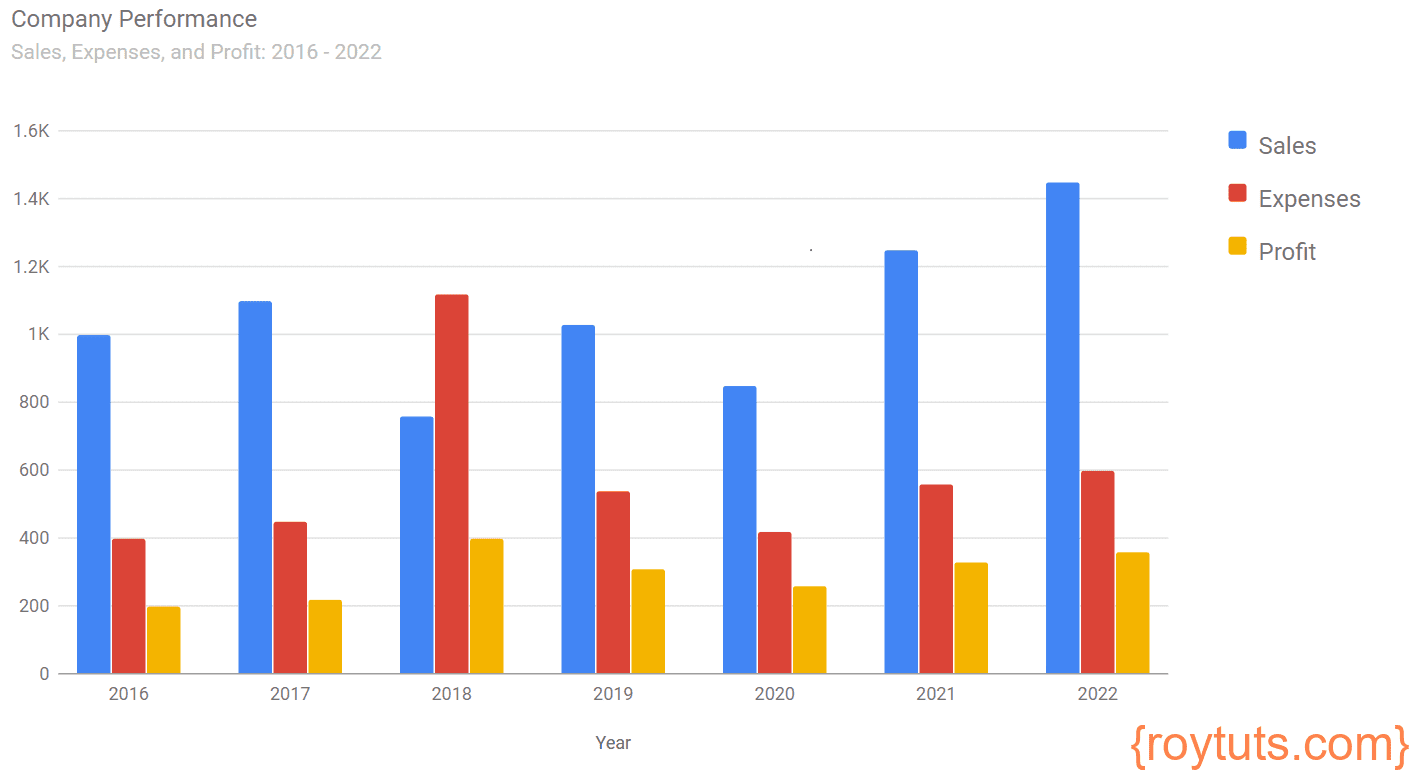
bar chart, line chart, pie chart etc.You can integrate Google chart with any server side technology but here I will show you how to integrate Google column chart with Codeigniter. This tutorial shows step by step so that you can understand how it build it. It displays the data for Company Performance for last five years in column or bar chart. You can also use other charts for any purpose. In this example I have used data coming from database. You can change the source of data as per your requirements.
Prerequisites
PHP 7.4.27, CodeIgniter 3.1.11, MySQL 8.0.26, Apache HTTP Server 2.4 (Optional)
Project Setup
Now I will create a project root directory called codeigniter-google-column-chart in the physical drive of the computer or under the Apache server’s htdocs folder if Apache server is used for this project.
Now move all the directories and files from CodeIgniter framework into codeigniter-google-column-chart directory.
I may not mention the project root directory in subsequent sections and I will assume that I am talking with respect to the project root directory.
MySQL Table
In order to build the column chart I need to display some data on the chart otherwise nothing will be shown in the chart. I will create a table called performance under roytuts database in MySQL server.
CREATE TABLE `performance` (
  `performance_id` int unsigned COLLATE utf8mb4_unicode_ci NOT NULL AUTO_INCREMENT,
  `performance_year` SMALLINT unsigned COLLATE utf8mb4_unicode_ci NOT NULL,
  `performance_sales` int unsigned COLLATE utf8mb4_unicode_ci NOT NULL,
  `performance_expense` double COLLATE utf8mb4_unicode_ci NOT NULL,
  `performance_profit` double COLLATE utf8mb4_unicode_ci NOT NULL,
  PRIMARY KEY (`performance_id`)
) ENGINE=InnoDB AUTO_INCREMENT=1 DEFAULT CHARSET=utf8mb4 COLLATE=utf8mb4_unicode_ci;
I am also storing some sample data which will be displayed on the column or bar chart.
insert  into `performance`(`performance_id`,`performance_year`,`performance_sales`,`performance_expense`,`performance_profit`) values
(1,2016,1000,400,200),
(2,2017,1100,450,220),
(3,2018,760,1120,400),
(4,2019,1030,540,310),
(5,2020,850,420,260),
(6,2021,1250,560,330),
(7,2022,1450,600,360);
Auto-load Configuration
Now modify application/config/autoload.php file for auto-loading database library.
$autoload['libraries'] = array('database');Database Configuration
Go to location application/config/database.php file and change database parameter values for below parameters:
...
'hostname' => 'localhost',
'username' => 'root',
'password' => 'root',
'database' => 'roytuts',
...
'char_set' => 'utf8mb4',
'dbcollat' => 'utf8mb4_unicode_ci',
...
Model Class
The model class is used to interact with database and to perform the required database operations such as select, insert, update, delete, etc.
Create a model file chartmodel.php under application/models directory with the below source code:
<?php

defined('BASEPATH') OR exit('No direct script access allowed');

/**
 * Description of BlogModel
 *
 * @author https://roytuts.com
 */
class ChartModel extends CI_Model {

    private $performance = 'performance';

    function __construct() {

    }


    function get_chart_data() {
        $query = $this->db->get($this->performance);
        $results['chart_data'] = $query->result();
        $this->db->select_min('performance_year');
        $this->db->limit(1);
        $query = $this->db->get($this->performance);
        $results['min_year'] = $query->row()->performance_year;
        $this->db->select_max('performance_year');
        $this->db->limit(1);
        $query = $this->db->get($this->performance);
        $results['max_year'] = $query->row()->performance_year;
        return $results;
    }

}
Controller Class
The controller class is responsible for handling requests/responses from clients and validating user inputs.
Create a controller file chartcontroller.php under application/controllers with the following source code:
<?php

defined('BASEPATH') OR exit('No direct script access allowed');

/**
 * Description of Blog
 *
 * @author https://roytuts.com
 */
class ChartController extends CI_Controller {

    function __construct() {
        parent::__construct();
        $this->load->model('chartmodel', 'chart');
    }

    public function index() {
        $results = $this->chart->get_chart_data();
        $data['chart_data'] = $results['chart_data'];
        $data['min_year'] = $results['min_year'];
        $data['max_year'] = $results['max_year'];
        $this->load->view('column_chart', $data);
    }

}
View File
The view file or template file is used to display data to the end users.
Create a view file column_chart.php under application/views folder.
<?php
defined('BASEPATH') OR exit('No direct script access allowed');
?><!DOCTYPE html>
<html lang="en">
<head>
        <meta charset="UTF-8"/>
        <title></title>
        <!-- Load Google chart api -->
        <script type="text/javascript" src="https://www.google.com/jsapi"></script>
        <script type="text/javascript">
            google.load("visualization", "1.1", {packages: ['bar', 'timeline']});
            google.setOnLoadCallback(drawChart);
            function drawChart() {
                var data = google.visualization.arrayToDataTable([
                    [{type: 'string', label: 'Year'}, {type: 'number', label: 'Sales'}, 'Expenses', 'Profit'],
					<?php
						foreach ($chart_data as $data) {
							echo '[' . $data->performance_year . ',' . $data->performance_sales . ',' . $data->performance_expense . ',' . $data->performance_profit . '],';
						}
					?>
                ]);

                var options = {
                    chart: {
                        title: 'Company Performance',
                        subtitle: 'Sales, Expenses, and Profit: <?php echo $min_year . ' - ' . $max_year; ?>'
                    }
                };

                var chart = new google.charts.Bar(document.getElementById('columnchart_material'));

                chart.draw(data, options);
            }
        </script>
    </head>
    <body>
        <div id="columnchart_material" style="width: 900px; height: 500px;"></div>
    </body>
</html>
Route Configuration
Modify file application/config/routes.php file to point to the correct controller class file.
$route['default_controller'] = 'chartcontroller';Testing Google Column Chart
When your home page is displayed by accessing the URL http://localhost in the browser:
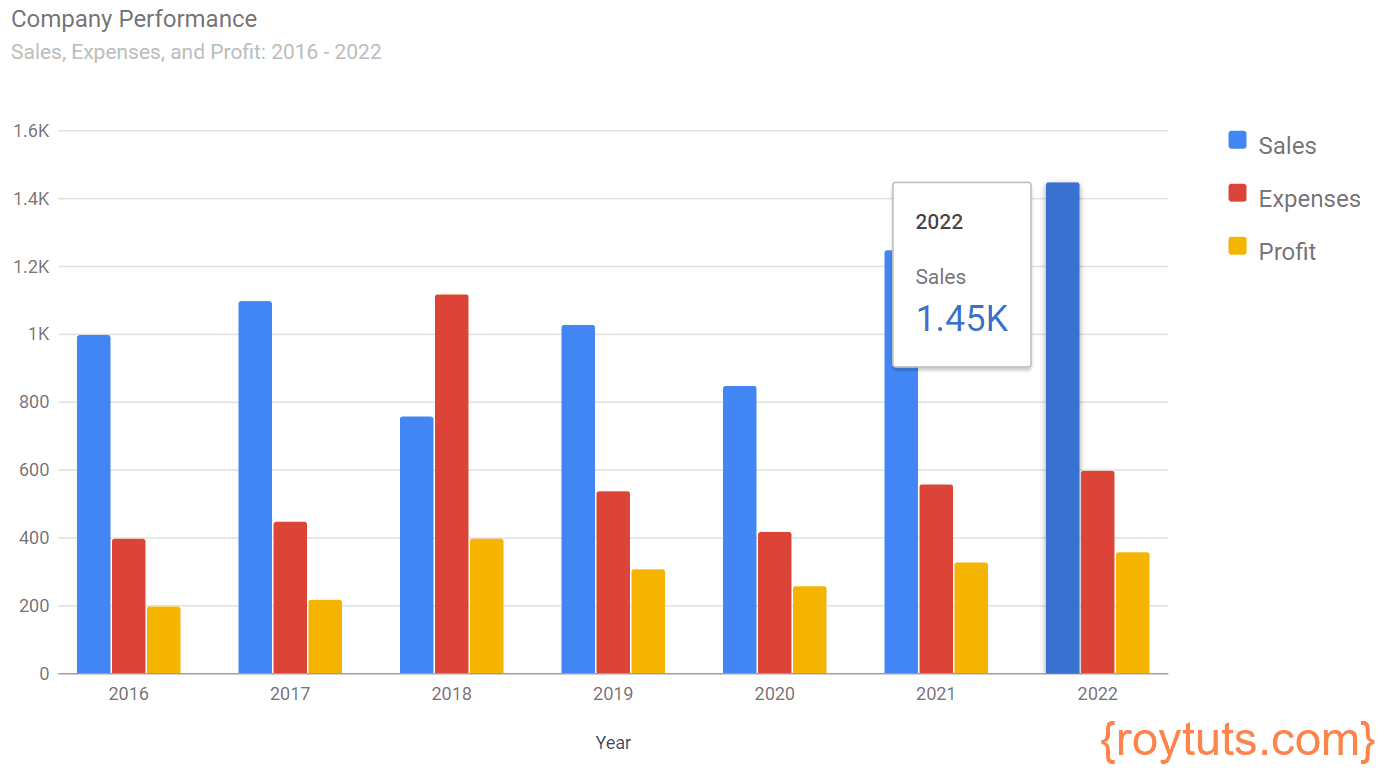
When you mouse hover a particular bar or column of the chart:
Hope you got an idea how to build google column chart using Codeigniter framework.
Thank you for your code works well but how to use Pie Chart for example instead of Bar
Thanks master, very usefull for me :D