Bar or Column Chart
In this example, you will see how to generate bar chart or column chart in excel file using Apache POI library in Java. I will show you how to build this application using both maven and gradle tools. This is a standalone application and you can use this concept of bar chart or column chart generation in any Java based application. In this example, I will create bar chart and column chart for displaying area-wise top seven countries.
A bar chart or bar graph is a chart or graph that presents categorical data with rectangular bars with heights or lengths proportional to the values that they represent. The bars can be plotted vertically or horizontally. When plotted vertically it’s called column chart.
Related Posts:
Bar charts have a discrete domain of categories, and are usually scaled so that all the data can fit on the chart. When there is no natural ordering of the categories being compared, bars on the chart may be arranged in any order. Bar charts arranged from highest to lowest incidence are called Pareto charts. Bar graphs/charts provide a visual presentation of categorical data.
Prerequisites
Java 8+, Apache POI 4.1.1/5.2.2, Gradle 5.6, Maven 3.6.1/3.8.5
Project Setup
The name of the project is apache-poi-excel-bar-column-chart. For the maven based project you can use below pom.xml file.
<?xml version="1.0" encoding="UTF-8"?>

<project xmlns="http://maven.apache.org/POM/4.0.0" xmlns:xsi="http://www.w3.org/2001/XMLSchema-instance" xsi:schemaLocation="http://maven.apache.org/POM/4.0.0 http://maven.apache.org/xsd/maven-4.0.0.xsd">
	<modelVersion>4.0.0</modelVersion>

	<groupId>com.roytuts</groupId>
	<artifactId>apache-poi-excel-bar-column-chart</artifactId>
	<version>0.0.1-SNAPSHOT</version>

	<properties>
		<project.build.sourceEncoding>UTF-8</project.build.sourceEncoding>
		<maven.compiler.source>11</maven.compiler.source>
		<maven.compiler.target>11</maven.compiler.target>
	</properties>

	<dependencies>
		<dependency>
			<groupId>org.apache.poi</groupId>
			<artifactId>poi-ooxml</artifactId>
			<version>5.2.2</version>
		</dependency>

		<!-- required only if you are using jdk 9 or above -->
		<dependency>
			<groupId>com.fasterxml.jackson.core</groupId>
			<artifactId>jackson-databind</artifactId>
			<version>2.13.3</version>
		</dependency>
	</dependencies>

	<build>
		<plugins>
			<plugin>
				<groupId>org.apache.maven.plugins</groupId>
				<artifactId>maven-compiler-plugin</artifactId>
				<version>3.8.1</version>
			</plugin>
		</plugins>
	</build>
</project>
If you are creating gradle based project, then use below build.gradle script to include the required dependencies.
plugins {
    id 'java-library'
}

sourceCompatibility = 12
targetCompatibility = 12

repositories {
    jcenter()
}

dependencies {
    implementation 'org.apache.poi:poi-ooxml:4.1.1'
    //required only for jdk 9 or above
    implementation('com.fasterxml.jackson.core:jackson-databind:2.10.1')
}
Create Bar and Column Chart
Now I will create a Java class to create bar chart and column chart in excel file using Apache POI library. The charts will display area-wise top seven countries in the world.
public class ApachePoiBarChart {

	public static void main(String[] args) throws IOException {
		barColumnChart();
	}

	public static void barColumnChart() throws FileNotFoundException, IOException {
		try (XSSFWorkbook wb = new XSSFWorkbook()) {

			String sheetName = "CountryBarChart";//"CountryColumnChart";

			XSSFSheet sheet = wb.createSheet(sheetName);

			// Create row and put some cells in it. Rows and cells are 0 based.
			Row row = sheet.createRow((short) 0);

			Cell cell = row.createCell((short) 0);
			cell.setCellValue("Russia");

			cell = row.createCell((short) 1);
			cell.setCellValue("Canada");

			cell = row.createCell((short) 2);
			cell.setCellValue("USA");

			cell = row.createCell((short) 3);
			cell.setCellValue("China");

			cell = row.createCell((short) 4);
			cell.setCellValue("Brazil");

			cell = row.createCell((short) 5);
			cell.setCellValue("Australia");

			cell = row.createCell((short) 6);
			cell.setCellValue("India");

			row = sheet.createRow((short) 1);

			cell = row.createCell((short) 0);
			cell.setCellValue(17098242);

			cell = row.createCell((short) 1);
			cell.setCellValue(9984670);

			cell = row.createCell((short) 2);
			cell.setCellValue(9826675);

			cell = row.createCell((short) 3);
			cell.setCellValue(9596961);

			cell = row.createCell((short) 4);
			cell.setCellValue(8514877);

			cell = row.createCell((short) 5);
			cell.setCellValue(7741220);

			cell = row.createCell((short) 6);
			cell.setCellValue(3287263);

			XSSFDrawing drawing = sheet.createDrawingPatriarch();
			XSSFClientAnchor anchor = drawing.createAnchor(0, 0, 0, 0, 0, 4, 7, 20);

			XSSFChart chart = drawing.createChart(anchor);
			chart.setTitleText("Area-wise Top Seven Countries");
			chart.setTitleOverlay(false);

			XDDFChartLegend legend = chart.getOrAddLegend();
			legend.setPosition(LegendPosition.TOP_RIGHT);

			XDDFCategoryAxis bottomAxis = chart.createCategoryAxis(AxisPosition.BOTTOM);
            bottomAxis.setTitle("Country");
            XDDFValueAxis leftAxis = chart.createValueAxis(AxisPosition.LEFT);
            leftAxis.setTitle("Area");
            leftAxis.setCrosses(AxisCrosses.AUTO_ZERO);

			XDDFDataSource<String> countries = XDDFDataSourcesFactory.fromStringCellRange(sheet,
					new CellRangeAddress(0, 0, 0, 6));

			XDDFNumericalDataSource<Double> values = XDDFDataSourcesFactory.fromNumericCellRange(sheet,
					new CellRangeAddress(1, 1, 0, 6));

			XDDFChartData data = chart.createData(ChartTypes.BAR, bottomAxis, leftAxis);
            XDDFChartData.Series series1 = data.addSeries(countries, values);
            series1.setTitle("Country", null);
			data.setVaryColors(true);
			chart.plot(data);

			// in order to transform a bar chart into a column chart, you just need to change the bar direction
            XDDFBarChartData bar = (XDDFBarChartData) data;
            bar.setBarDirection(BarDirection.BAR);
            //bar.setBarDirection(BarDirection.COL);

			// Write output to an excel file
            String filename = "bar-chart-top-seven-countries.xlsx";//"column-chart-top-seven-countries.xlsx";
			try (FileOutputStream fileOut = new FileOutputStream(filename)) {
				wb.write(fileOut);
			}
		}
	}

}
I will explain few important lines from the above class.
I have created XSSFWorkbook object and create a sheet with name CountryBarChart or CountryColumnChart.
Next, I have created two rows and 7 columns in the excel sheet. First row contains country names and second row contains each country’s area.
Then, I have created XSSFDrawing object and XSSFClientAnchor object.
In XSSFClientAnchor, I have set the range of the rows and columns or cells. The first two values indicate coordinates of x and y of first cell respectively. The next two values indicate coordinates of x and y of second cell respectively. The next two values indicate starting row index and column index of chart area. The next two values indicate ending row index and column index of chart area.
Now, I have created chart from the XSSFClientAnchor object using createChart(). I have set title to the chart.
The legends are shown on right side of the bar chart or column chart.
Then I create bottom axis and left axis. Bottom axis adds label “Country” and left axis adds label “Area”.
Next I define data source for drawing chart. I set country names as string and area as numeric values.
Then I plot the data onto bar chart or column chart.
Next I need to set direction whether I want it to be bar chart or column chart.
Finally I write the chart into excel file.
Testing Bar or Column Chart
Running the above main class will generate the bar chart and column chart in excel similar to the following images.
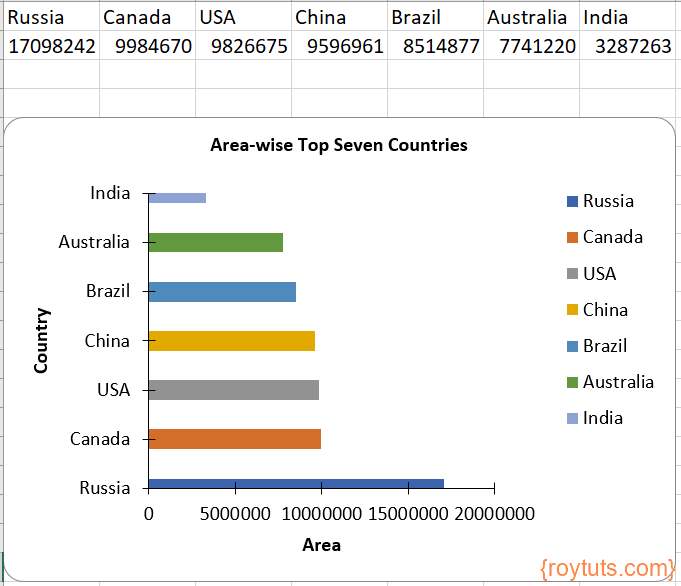
Bar Chart
The following image shows how bar chart looks in the excel sheet:
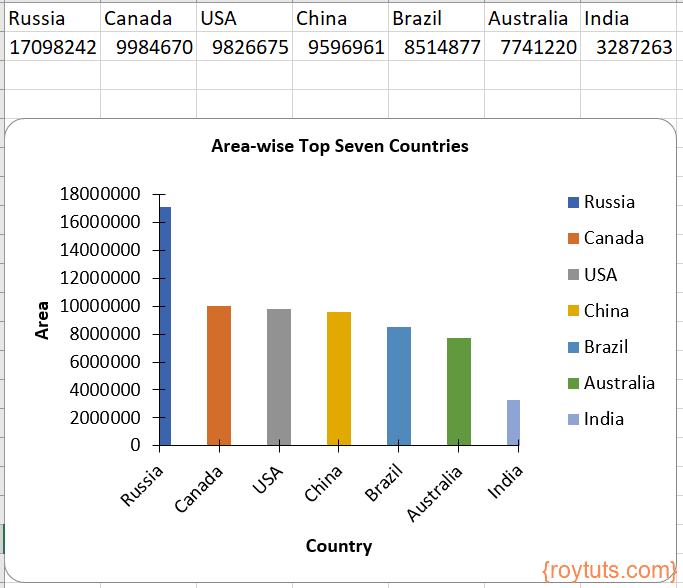
Column Chart
The following image shows how column chart looks in the excel sheet:
How to add multiple series of data in the chart.
What I did to “fix” it was adding this: leftAxis.setCrossBetween(AxisCrossBetween.BETWEEN);
Another question: do you know if there is a way to put the value at the end of the bar? I mean, at the in each bar, I want to put the value (number) accordingly?
Is there a way to change the bars? For example, I need to change the first and the last bars. As you can see, both bars are halfed due the limits of the chart.
Is there a way to change this?
It depends on the value of the bar or column