Stacked Bar/Column Chart
In this tutorial I will show you how to create stacked bar chart or column chart in excel file using Java based Apache POI library. I will also show you how to build this application using both maven and gradle build tools. This is a standalone application and you can use this concept of stacked bar chart or column chart generation in any Java based application. In this example, I will create stacked bar chart and column chart for displaying area-wise top seven countries. Population will be stacked on top of the area.
A stacked bar chart is used to break down and compare parts of a whole. A bar in the chart represents a whole and segments in the bar represent different parts or subcategories of the whole.
Related Posts:
Prerequisites
Java 8+, Apache POI 4.1.1/5.2.2, Gradle 5.6, Maven 3.6.1/3.8.5
Project Setup
The name of the project is apache-poi-excel-stacked-bar-column-chart. For maven based project you can use below pom.xml file.
For Apache POI 5.2.2, use the following pom.xml file:
<?xml version="1.0" encoding="UTF-8"?>

<project xmlns="http://maven.apache.org/POM/4.0.0" xmlns:xsi="http://www.w3.org/2001/XMLSchema-instance" xsi:schemaLocation="http://maven.apache.org/POM/4.0.0 http://maven.apache.org/xsd/maven-4.0.0.xsd">
	<modelVersion>4.0.0</modelVersion>

	<groupId>com.roytuts</groupId>
	<artifactId>apache-poi-excel-stacked-bar-column-chart</artifactId>
	<version>0.0.1-SNAPSHOT</version>

	<properties>
		<project.build.sourceEncoding>UTF-8</project.build.sourceEncoding>
		<maven.compiler.source>11</maven.compiler.source>
		<maven.compiler.target>11</maven.compiler.target>
	</properties>

	<dependencies>
		<dependency>
			<groupId>org.apache.poi</groupId>
			<artifactId>poi-ooxml</artifactId>
			<version>5.2.2</version>
		</dependency>

		<dependency>
			<groupId>org.apache.poi</groupId>
			<artifactId>poi-ooxml-full</artifactId>
			<version>5.2.2</version>
		</dependency>

		<!-- required only if you are using jdk 9 or above -->
		<dependency>
			<groupId>com.fasterxml.jackson.core</groupId>
			<artifactId>jackson-databind</artifactId>
			<version>2.13.3</version>
		</dependency>
	</dependencies>

	<build>
		<plugins>
			<plugin>
				<groupId>org.apache.maven.plugins</groupId>
				<artifactId>maven-compiler-plugin</artifactId>
				<version>3.8.1</version>
			</plugin>
		</plugins>
	</build>
</project>
For Apache POI 4.1.1, use the following pom.xml file:
<project xmlns="http://maven.apache.org/POM/4.0.0" xmlns:xsi="http://www.w3.org/2001/XMLSchema-instance"
	xsi:schemaLocation="http://maven.apache.org/POM/4.0.0 http://maven.apache.org/xsd/maven-4.0.0.xsd">
	<modelVersion>4.0.0</modelVersion>

	<groupId>com.roytuts</groupId>
	<artifactId>apache-poi-excel-stacked-bar-column-chart</artifactId>
	<version>0.0.1-SNAPSHOT</version>
	<packaging>jar</packaging>

	<properties>
		<project.build.sourceEncoding>UTF-8</project.build.sourceEncoding>
		<java.version>1.8 or 12</java.version>
	</properties>

	<dependencies>
		<dependency>
			<groupId>org.apache.poi</groupId>
			<artifactId>poi-ooxml</artifactId>
			<version>4.1.1</version>
		</dependency>

		<!-- required only if you are using jdk 9 or above -->
		<dependency>
			<groupId>com.fasterxml.jackson.core</groupId>
			<artifactId>jackson-databind</artifactId>
			<version>2.10.1</version>
		</dependency>
	</dependencies>

	<build>
		<plugins>
			<plugin>
				<groupId>org.apache.maven.plugins</groupId>
				<artifactId>maven-compiler-plugin</artifactId>
				<version>3.8.1</version>
				<configuration>
					<source>${java.version}</source>
					<target>${java.version}</target>
				</configuration>
			</plugin>
		</plugins>
	</build>
</project>
If you are creating gradle based project in Eclipse, then use below build.gradle script to include the required dependencies.
plugins {
    id 'java-library'
}

sourceCompatibility = 12
targetCompatibility = 12

repositories {
    jcenter()
}

dependencies {
    implementation 'org.apache.poi:poi-ooxml:4.1.1'
    //required only for jdk 9 or above
    implementation('com.fasterxml.jackson.core:jackson-databind:2.10.1')
}
Create Stacked Bar and Column Chart
Now I will create a Java class to create stacked bar chart and column chart in excel file using Apache POI library. The charts will display area-wise top seven countries in the world. On top of the area population will be stacked.
public class ApachePoiStackedBarChart {

	public static void main(String[] args) throws IOException {
		stackedBarChart();
	}

	public static void stackedBarChart() throws FileNotFoundException, IOException {
		try (XSSFWorkbook wb = new XSSFWorkbook()) {

			String sheetName = "CountryStackedBarChart";// "CountryStackedColumnChart";

			XSSFSheet sheet = wb.createSheet(sheetName);

			// Country Names
			Row row = sheet.createRow((short) 0);

			Cell cell = row.createCell((short) 0);
			cell.setCellValue("Russia");

			cell = row.createCell((short) 1);
			cell.setCellValue("Canada");

			cell = row.createCell((short) 2);
			cell.setCellValue("USA");

			cell = row.createCell((short) 3);
			cell.setCellValue("China");

			cell = row.createCell((short) 4);
			cell.setCellValue("Brazil");

			cell = row.createCell((short) 5);
			cell.setCellValue("Australia");

			cell = row.createCell((short) 6);
			cell.setCellValue("India");

			// Country Area
			row = sheet.createRow((short) 1);

			cell = row.createCell((short) 0);
			cell.setCellValue(17098242);

			cell = row.createCell((short) 1);
			cell.setCellValue(9984670);

			cell = row.createCell((short) 2);
			cell.setCellValue(9826675);

			cell = row.createCell((short) 3);
			cell.setCellValue(9596961);

			cell = row.createCell((short) 4);
			cell.setCellValue(8514877);

			cell = row.createCell((short) 5);
			cell.setCellValue(7741220);

			cell = row.createCell((short) 6);
			cell.setCellValue(3287263);

			// Country Population
			row = sheet.createRow((short) 2);

			cell = row.createCell((short) 0);
			cell.setCellValue(14590041);

			cell = row.createCell((short) 1);
			cell.setCellValue(35151728);

			cell = row.createCell((short) 2);
			cell.setCellValue(32993302);

			cell = row.createCell((short) 3);
			cell.setCellValue(14362887);

			cell = row.createCell((short) 4);
			cell.setCellValue(21172141);

			cell = row.createCell((short) 5);
			cell.setCellValue(25335727);

			cell = row.createCell((short) 6);
			cell.setCellValue(13724923);

			XSSFDrawing drawing = sheet.createDrawingPatriarch();
			XSSFClientAnchor anchor = drawing.createAnchor(0, 0, 0, 0, 0, 4, 7, 26);

			XSSFChart chart = drawing.createChart(anchor);
			chart.setTitleText("Area-wise Top Seven Countries");
			chart.setTitleOverlay(false);

			XDDFChartLegend legend = chart.getOrAddLegend();
			legend.setPosition(LegendPosition.TOP_RIGHT);

			XDDFCategoryAxis bottomAxis = chart.createCategoryAxis(AxisPosition.BOTTOM);
			bottomAxis.setTitle("Country");
			XDDFValueAxis leftAxis = chart.createValueAxis(AxisPosition.LEFT);
			leftAxis.setTitle("Area & Population");

			XDDFDataSource<String> countries = XDDFDataSourcesFactory.fromStringCellRange(sheet,
					new CellRangeAddress(0, 0, 0, 6));

			XDDFNumericalDataSource<Double> area = XDDFDataSourcesFactory.fromNumericCellRange(sheet,
					new CellRangeAddress(1, 1, 0, 6));

			XDDFNumericalDataSource<Double> population = XDDFDataSourcesFactory.fromNumericCellRange(sheet,
					new CellRangeAddress(2, 2, 0, 6));

			XDDFChartData data = chart.createData(ChartTypes.BAR, bottomAxis, leftAxis);
			XDDFChartData.Series series1 = data.addSeries(countries, area);
			series1.setTitle("Area", null);
			XDDFChartData.Series series2 = data.addSeries(countries, population);
			series2.setTitle("Population", null);
			data.setVaryColors(true);
			chart.plot(data);

			// correcting the overlap so bars really are stacked and not side by side
			chart.getCTChart().getPlotArea().getBarChartArray(0).addNewOverlap().setVal((byte) 100);

			// in order to transform a bar chart into a column chart, you just need to
			// change the bar direction
			XDDFBarChartData bar = (XDDFBarChartData) data;
			bar.setBarGrouping(BarGrouping.STACKED);
			bar.setBarDirection(BarDirection.BAR);
			// bar.setBarDirection(BarDirection.COL);

			// Write output to an excel file
			String filename = "bar-chart-top-seven-countries.xlsx";// "column-chart-top-seven-countries.xlsx";
			try (FileOutputStream fileOut = new FileOutputStream(filename)) {
				wb.write(fileOut);
			}
		}
	}

}
I have created XSSFWorkbook object and create a sheet with name CountryStackedBarChart or CountryStackedColumnChart.
Next I create three rows and 7 columns in the excel sheet. First row contains country names, second row contains each country’s area and third row contains each country’s population.
Please note the population data are not correct and it’s just representational purpose.
Then I create XSSFDrawing object and XSSFClientAnchor object.
In XSSFClientAnchor I have set the range of the rows and columns or cells. The first two values indicate coordinates of x and y of first cell respectively. The next two values indicate coordinates of x and y of second cell respectively. The next two values indicate starting row index and column index of chart area. The next two values indicate ending row index and column index of chart area.
Now I create chart from the XSSFClientAnchor object using createChart(). I set title to the chart.
The legends are shown on right side of the bar chart or column chart.
Then I create bottom axis and left axis. Bottom axis adds label “Country” and left axis adds label “Area & Population”.
Next I define data source for drawing chart. I set country names as string and area & population as numeric values.
I add numeric values in series as stacked bar.
Then I plot the data onto bar chart or column chart.
Next I need to set direction whether I want it to be bar chart or column chart.
Finally I write the chart into excel file.
Testing Stacked Bar or Column Chart
Running the above main class will generate the stacked bar chart and column chart in excel similar to the following images.
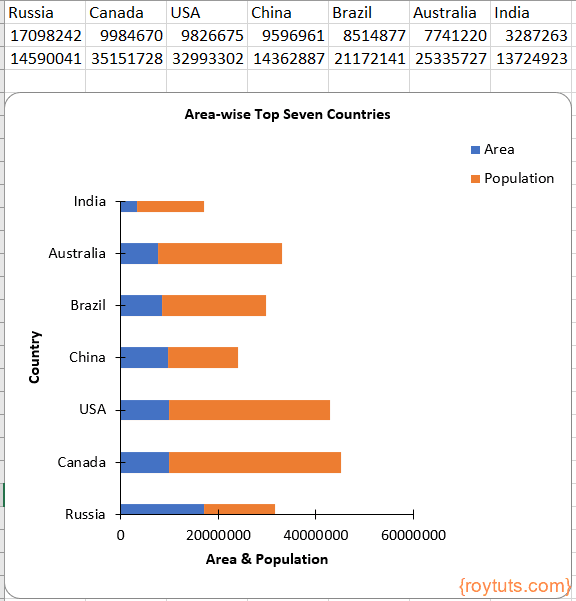
Stacked Bar Chart
The following image shows how stacked bar chart looks in the excel sheet:
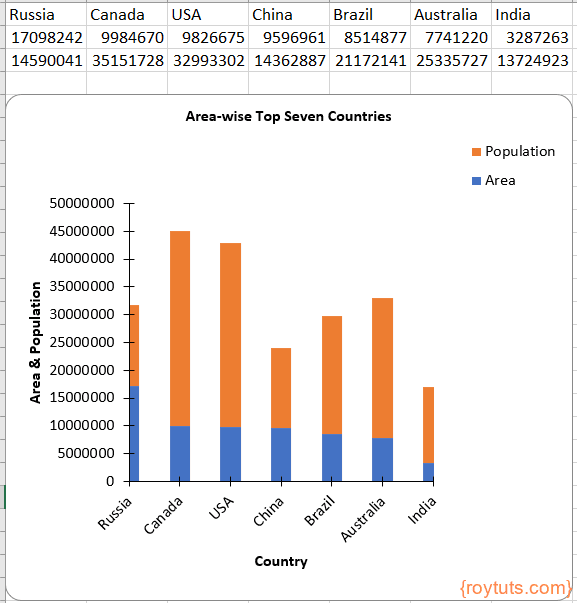
Stacked Column Chart
The following image shows how stacked column chart looks in the excel sheet:
Hi Even im using the above code for clustered bar chart grouping.
bar1.setBarGrouping(BarGrouping.CLUSTERED);
But my output is eliminating data for first and last value.
What im i missing
Hi
I am using the above code for clustered bar chart grouping.
bar1.setBarGrouping(BarGrouping.CLUSTERED);
But my output is eliminating data for first and last value.
Can you please share the proper code or changes I should make for clustered bar graph.