Introduction
Here I am going to explain how to trace Spring Boot Microservices logs with Spring Cloud Sleuth and Zipkin Server. Spring Cloud Sleuth provides Spring Boot auto-configuration for distributed tracing.
One of the problems most developers face difficulty of tracing logs as your microservices applications grow and requests propagate from one microservice to another microservice. So it could be quite part to try to figure out how a particular request travels through the application when you don’t have any idea regarding the implementation of microservices you are calling.
Spring Cloud Sleuth solves exactly this problem by introducing a unique id to your logging and this unique id is consistent between microservices calls. This also makes it possible to trace how a request travels from one microservice to another microservice.
Spring cloud Sleuth logs are printed in the following format:
[application-name,trace-id,span-id,zipkin-export]Where,
application-name is the name of the application in the application.properties or application.yml/yaml file.
Spring Cloud Sleuth adds two types of ids – one is trace-id and another one is span-id. The trace-id contains multiple span-ids and remains same as the request travels through one microservice to another microservice. The span-id indicates the basic unit of work, for example, sending request over HTTP.
zipkin-export indicates whether the logs can be exported to Zipkin server or not. The default value is false and if you want to export it to Zipkin server you need to make it true.
For example, if you have added any logger to your application code then you will see the log in the above format. Let’s assume I have added logger in fahrenheit to celsius converter microservice and the log I see is:
[fahrenheit-to-celsius-converter,1a1e90ebe94b8cab,1a1e90ebe94b8cab,true] 21460 --- [io-9000-exec-10] .f.t.c.c.FahrenheitToCelsiusConverterApp : Fahrenheit to Celsius: 100.0 -> 37.77778So the information you see in the log is quite useful but quite cumbersome. Using ELK stack to collect and analyze the logs from microservices can be very useful. By using the trace id you can easily search how a request was passed from one microservice to another microservice across the collected logs.
Zipkin server is useful when you need to see the timing information. You can calculate the time manually for a request that travels from one microservice to next but it is really painful. So Spring Cloud Sleuth configures the apps, so that timing of these requests are recorded into a distributed system called Zipkin. You can trace these information visually on UI, such as time in one service vs waiting for other services.
Sleuth helps not only to track timing, but also to catch errors so that they can be analyzed or correlated with logs. Without distributed tracing, it can be difficult to understand the impact of a an exception. For example, it can be hard to know if a specific request caused the caller to fail or not. Zipkin reduces time by contextualizing errors and delays.
Once you find any log with an error, you can look for the trace ID in the message. Paste that into Zipkin to visualize the entire trace, regardless of how many services the first request ended up hitting.
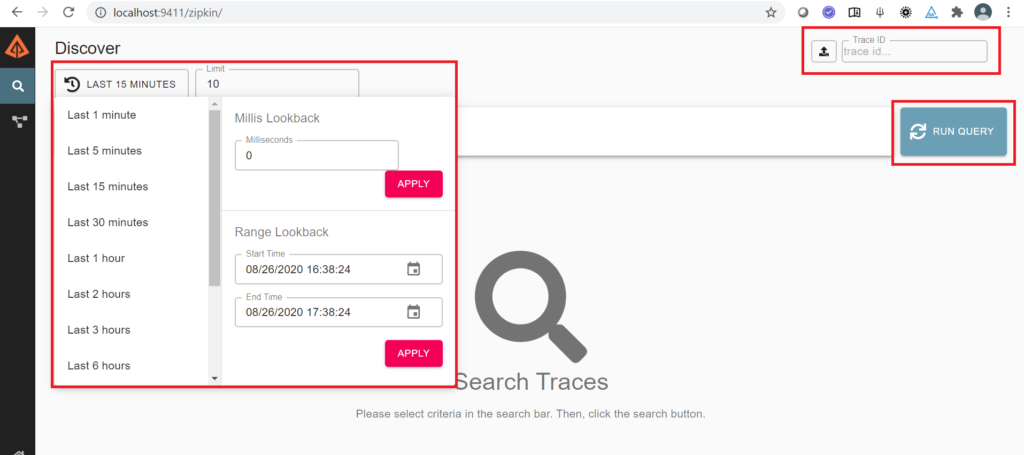
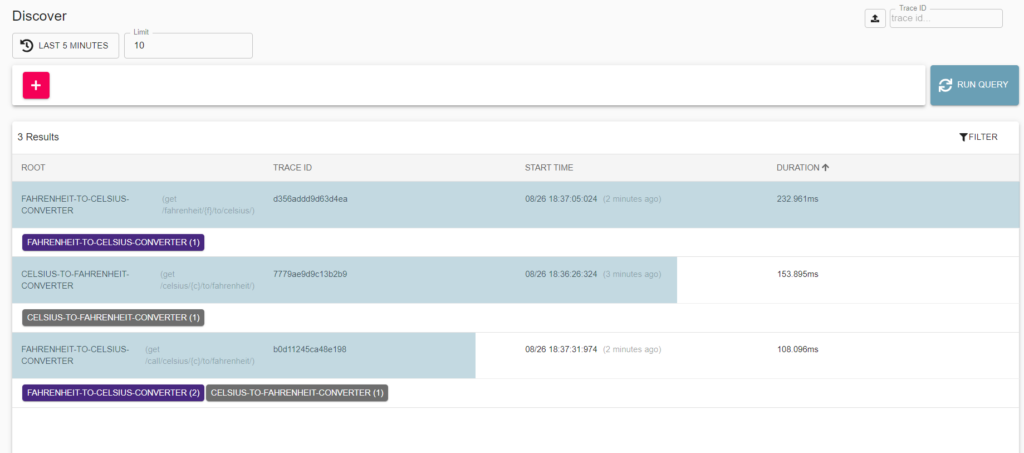
When you run the Zipkin server it runs on default port 9411 in localhost. You can search by trace id and hit the Run Query button to search for log information. You can also discover for last n minutes or hours or using the custom date time as an input as shown in the below image:
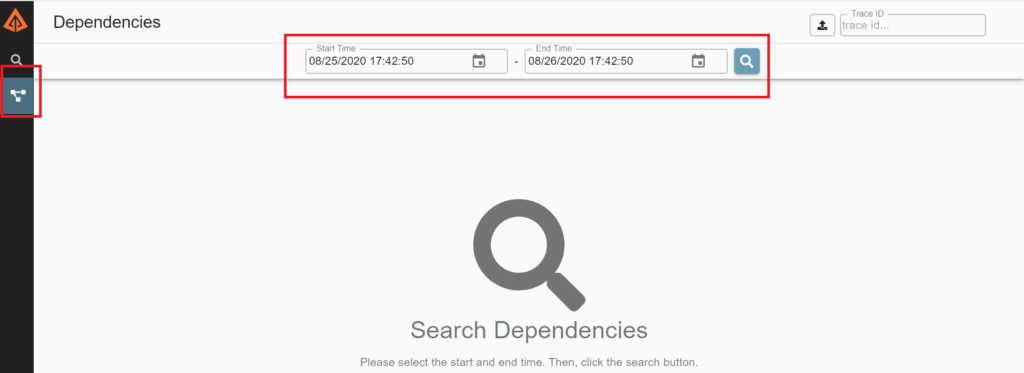
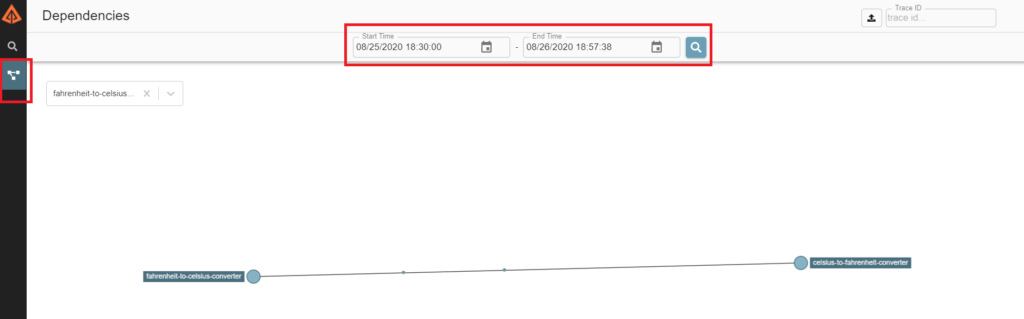
Zipkin includes a tool to build service dependency diagrams from traces, including the count of calls and how many errors exist.
You can find more useful information here, so let’s move on to implementation of an example.
Prerequisites
Java at least 8, Gradle 6.5.1, Spring Boot 2.3.3, Spring Cloud Sleuth, Zipkin
Microservices
For this example I will create two microservices – Celsius to Fahrenheit converter and Fahrenheit to Celsius converter. I am not going to explain here what is microservice but you can read my other tutorial on building microservices using Spring Boot framework.
I may not put all parts of the code here but you can download the whole source code later from the link given at the end of the tutorial.
Celsius to Fahrenheit Converter
In celsius to fahrenheit converter, it will give you the result in fahrenheit for the given celsius temperature.
package com.roytuts.spring.celsius.to.fahrenheit.converter;

import org.slf4j.Logger;
import org.slf4j.LoggerFactory;
import org.springframework.boot.SpringApplication;
import org.springframework.boot.autoconfigure.SpringBootApplication;
import org.springframework.context.annotation.Bean;
import org.springframework.http.HttpStatus;
import org.springframework.http.ResponseEntity;
import org.springframework.web.bind.annotation.GetMapping;
import org.springframework.web.bind.annotation.PathVariable;
import org.springframework.web.bind.annotation.RestController;

import brave.sampler.Sampler;

@RestController
@SpringBootApplication(exclude = { org.springframework.boot.autoconfigure.gson.GsonAutoConfiguration.class })
public class CelsiusToFahrenheitConverterApp {

	private static final Logger LOGGER = LoggerFactory.getLogger(CelsiusToFahrenheitConverterApp.class.getName());

	public static void main(String[] args) {
		SpringApplication.run(CelsiusToFahrenheitConverterApp.class, args);
	}

	@GetMapping("/celsius/{c}/to/fahrenheit/")
	public ResponseEntity<Float> convertCelsiusToFahrenheit(@PathVariable("c") float celsius) {
		float f = (float) (32 + 1.8 * celsius);

		LOGGER.info("Celsius to Fahrenheit: {} -> {}", celsius, f);

		return new ResponseEntity<Float>(f, HttpStatus.OK);
	}

	@Bean
	public Sampler defaultSampler() {
		return Sampler.ALWAYS_SAMPLE;
	}

}
By default Spring Cloud Sleuth does not sample spans. That means that traces appear in logs but not in any remote store. For example, it does not appear in Zipkin. So here I am exporting everything to Zipkin using the bean defaultSample().
Fahrenheit to Celsius Converter
In fahrenheit to celsius converter, it will give you the result in celsius for the given fahrenheit temperature.
Notice another thing in the below source code, I am also calling the above REST API from the below microservice so that I can get the trace in Zipkin UI for the request flow from one microservice to next.
package com.roytuts.spring.fahrenheit.to.celsius.converter;

import org.slf4j.Logger;
import org.slf4j.LoggerFactory;
import org.springframework.boot.SpringApplication;
import org.springframework.boot.autoconfigure.SpringBootApplication;
import org.springframework.context.annotation.Bean;
import org.springframework.http.HttpStatus;
import org.springframework.http.ResponseEntity;
import org.springframework.web.bind.annotation.GetMapping;
import org.springframework.web.bind.annotation.PathVariable;
import org.springframework.web.bind.annotation.RestController;
import org.springframework.web.client.RestTemplate;

import brave.sampler.Sampler;

@RestController
@SpringBootApplication(exclude = { org.springframework.boot.autoconfigure.gson.GsonAutoConfiguration.class })
public class FahrenheitToCelsiusConverterApp {

	private static final Logger LOGGER = LoggerFactory.getLogger(FahrenheitToCelsiusConverterApp.class.getName());

	public static void main(String[] args) {
		SpringApplication.run(FahrenheitToCelsiusConverterApp.class, args);
	}

	@GetMapping("/fahrenheit/{f}/to/celsius/")
	public ResponseEntity<Float> convertFahrenheitToCelsius(@PathVariable("f") float fahrenheit) {
		float c = (float) ((fahrenheit - 32) / 1.8);

		LOGGER.info("Fahrenheit to Celsius: {} -> {}", fahrenheit, c);

		return new ResponseEntity<Float>(c, HttpStatus.OK);
	}

	@Bean
	public Sampler defaultSampler() {
		return Sampler.ALWAYS_SAMPLE;
	}

	@Bean
	public RestTemplate restTemplate() {
		return new RestTemplate();
	}

	@GetMapping("/call/celsius/{c}/to/fahrenheit/")
	public ResponseEntity<Float> callCelsiusToFahrenheit(@PathVariable("c") float celsius) {
		LOGGER.info("callCelsiusToFahrenheit()");

		return restTemplate().getForEntity("http://localhost:8000/celsius/" + celsius + "/to/fahrenheit/", Float.class);
	}

}
You need the following dependency for Sleuth/Zipkin for the both microservices above:
implementation("org.springframework.cloud:spring-cloud-starter-zipkin")Eureka Server
Eureka server configuration is given below to discover your microservices.
package com.roytuts.spring.microservices.eureka.server;

import org.springframework.boot.SpringApplication;
import org.springframework.boot.autoconfigure.SpringBootApplication;
import org.springframework.cloud.netflix.eureka.server.EnableEurekaServer;

@EnableEurekaServer
@SpringBootApplication(exclude = { org.springframework.boot.autoconfigure.gson.GsonAutoConfiguration.class })
public class EurekaServerApp {

	public static void main(String[] args) {
		SpringApplication.run(EurekaServerApp.class, args);
	}

}
Make sure your Zipkin server is already running otherwise your microservices will not be able to connect to Zipkin server and will throw exception.
Zipkin Server is a Java 1.8+ service, packaged as an executable jar. Zipkin server requires minimum JRE 8.
Span storage and collectors are configurable. By default, storage is in-memory, the HTTP collector (POST /api/v2/spans endpoint) is enabled, and the server listens on port 9411.
You can download the Zipkin server jar from the link. To run the jar you just need to execute the command java -jar <zipkin jar name>. For example if your Zipkin jar name is zipkin-server-2.21.7-exec.jar then you need to execute command java -jar zipkin-server-2.21.7-exec.jar.
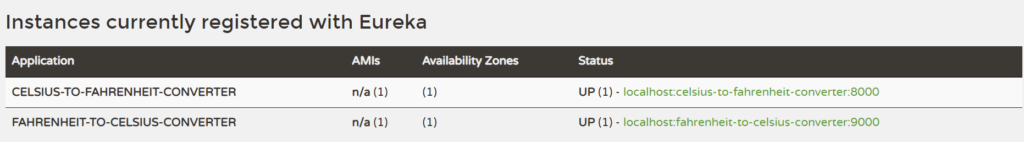
Once you run microservices and eureka server apps then you can see all instances for microservices are up at URL http://localhost:8761/ as shown in the following image:
Testing the Application
When your all microservices are running you can hit each of the REST endpoints in from the REST client and see what you get in the trace.
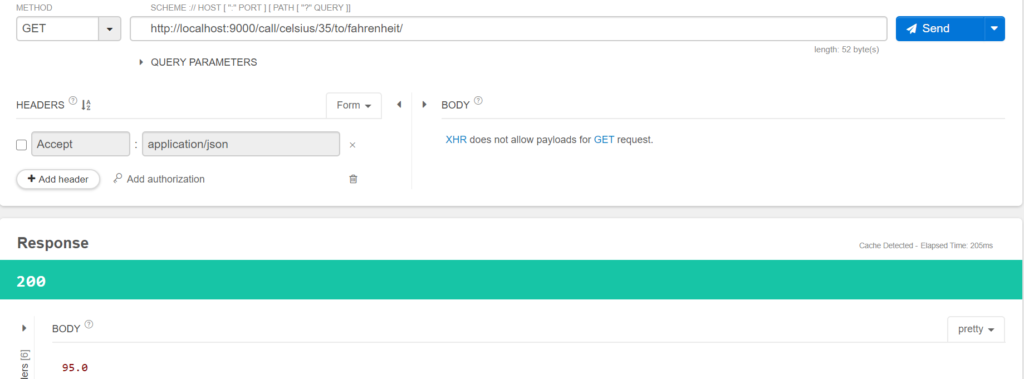
First I call celsius to fahrenheit converter endpoint as shown in the below image:
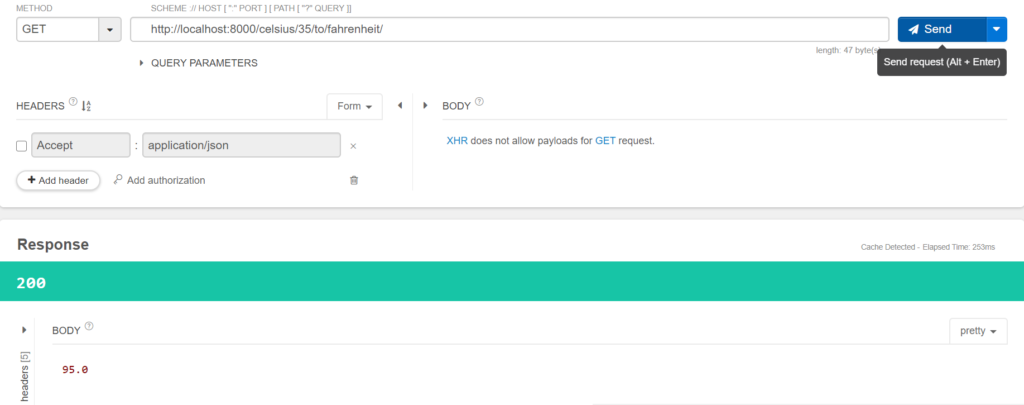
The log you will see for the above call is given below:
INFO [celsius-to-fahrenheit-converter,7779ae9d9c13b2b9,7779ae9d9c13b2b9,true] 3776 --- [nio-8000-exec-6] .c.t.f.c.CelsiusToFahrenheitConverterApp : Celsius to Fahrenheit: 35.0 -> 95.0Then I can fahrenheit to celsius converter endpoint:
The log you will see for the above call is given below:
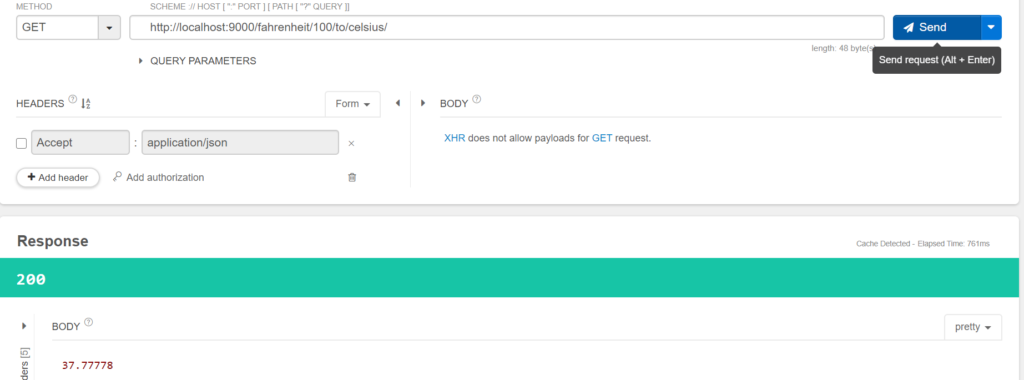
INFO [fahrenheit-to-celsius-converter,d356addd9d63d4ea,d356addd9d63d4ea,true] 13796 --- [nio-9000-exec-1] .f.t.c.c.FahrenheitToCelsiusConverterApp : Fahrenheit to Celsius: 100.0 -> 37.77778Then I call internally celsius to fahrenheit converter from fahrenheit to celsius converter service:
The log you will see for the above call is given below:
INFO [fahrenheit-to-celsius-converter,b0d11245ca48e198,b0d11245ca48e198,true] 13796 --- [nio-9000-exec-2] .f.t.c.c.FahrenheitToCelsiusConverterApp : callCelsiusToFahrenheit()Now let’s check the trace in Zipkin UI. Check for last 5 or 15 minutes according to the elapsed time. You will see something similar to the below image:
Now you can click on each trace to find more information on each request. For example, if you click on FAHRENHEIT-TO-CELSIUS-CONVERTER trace then you will find the request flow as shown below in the image. So here I made two calls.
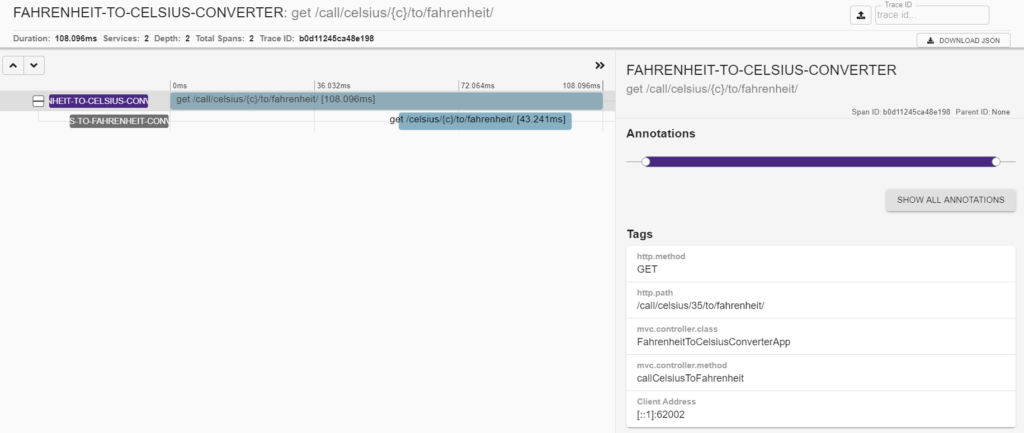
You also the time taken for each call on the right side.
You can also generate dependency graph for a particular request flow:
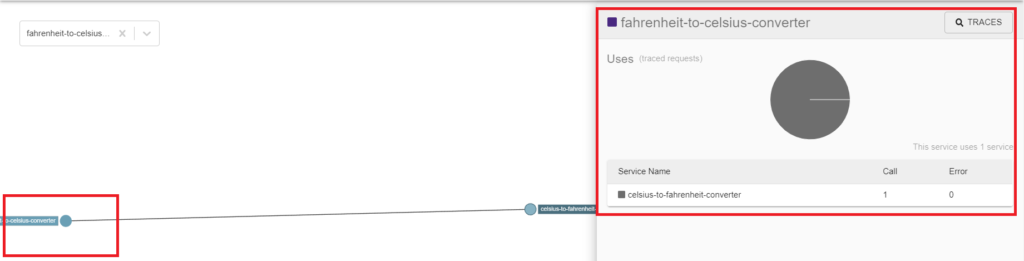
Clicking on each node you can find number of call and if there was any error or not in the request.
That’s all. Hope you got an idea on why do we need to use Spring Cloud Sleuth with Zipkin in Spring Boot Microservices.
Source Code
Thanks for reading.
I’m having a little problem I cannot seem to be able to subscribe your feed, I’m using google reader fyi.