Introduction
In this example we will see how to display data on XChart using AJAX, jQuery, Python Flask and MySQL. XChart displays different statistical data on different chart types such as column chart, bar chart, line chart, pie chart etc.
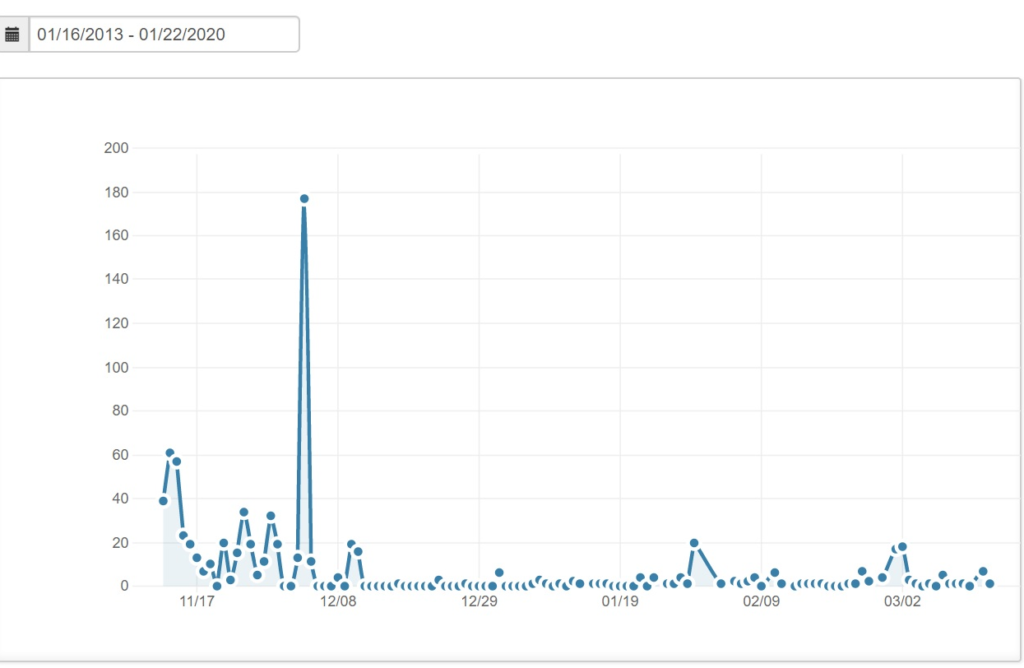
This tutorial shows step by step so that we can understand how it happens. It displays the data for site visitors log in line chart. I have also put a calendar for date-picker so that you can pick a custom range of dates and get the visitor statistics in xchart. The calendar has more features like you can select Yesterday, Last One week, Last One month etc. On mouse hover on the line chart you can see the visitors count on a particular date.
Prerequisites
Python 3.8.0, Flask 1.1.1, MySQL 8.0.17, jQuery, AJAX, XChart API
Create MySQL Table
As we are going to display data from MySQL database, so we need a table and data into this table to be able to fetch data from the table.
We will create an site_log table and dump some sample data into it. The sample data can be downloaded later from this tutorial at the bottom.
CREATE TABLE IF NOT EXISTS `site_log` (
  `site_log_id` int(10) unsigned NOT NULL AUTO_INCREMENT,
  `no_of_visits` int(10) unsigned NOT NULL,
  `ip_address` varchar(20) NOT NULL,
  `requested_url` tinytext NOT NULL,
  `referer_page` tinytext NOT NULL,
  `page_name` tinytext NOT NULL,
  `query_string` tinytext NOT NULL,
  `browser` tinytext NOT NULL,
  `is_unique` tinyint(1) NOT NULL DEFAULT '0',
  `access_date` timestamp NOT NULL DEFAULT CURRENT_TIMESTAMP,
  PRIMARY KEY (`site_log_id`)
) ENGINE=InnoDB AUTO_INCREMENT=2425 DEFAULT CHARSET=utf8mb4 COLLATE=utf8mb4_0900_ai_ci;
Create Project Directory
Create a project root directory called python-flask-xchart as per your chosen location.
Related Posts:
We may not mention the project’s root directory name in the subsequent sections but we will assume that we are creating files with respect to the project’s root directory.
Configure Flask
We here configure application through flask framework. Create a file called app.py with the below code.
from flask import Flask

app = Flask(__name__)
Database Configuration
We create the below db.py Python script to setup the MySQL database configurations for connecting to database and storing user information into employee table under roytuts database.
We need to configure database connection with flask module and that’s why we have imported app module and setup the MySQL configuration with flask module.
Make sure to change the database configuration values according to your database setup.
from app import app
from flaskext.mysql import MySQL

mysql = MySQL()

# MySQL configurations
app.config['MYSQL_DATABASE_USER'] = 'root'
app.config['MYSQL_DATABASE_PASSWORD'] = 'root'
app.config['MYSQL_DATABASE_DB'] = 'roytuts'
app.config['MYSQL_DATABASE_HOST'] = 'localhost'
mysql.init_app(app)
Configure URLs and Retrieve Records
Now we will configure URLs for rendering template file for front-end or UI which will be displayed to the end users.
We will also retrieve data from MySQL database table site_log and display on XChart. The data are fetched from MySQL database using REST API and displayed on XChart.
Create a Python script called main.py with the following source code.
We display chart data for the current day while home page is displayed if data found for the current day otherwise no datum is displayed on chart.
The endpoint /xchart which exposes API over http protocol and using this endpoint we display data on the XChart. We pass start and end date into this endpoint to fetch data for the given data range.
import pymysql
from app import app
from db import mysql
from flask import jsonify, request, render_template

@app.route('/')
def home():
	return render_template('xchart.html')

@app.route('/xchart', methods=['POST'])
def x_chart():
	conn = None
	cursor = None

	_json = request.json
	start_date = _json['start']
	end_date = _json['end']

	try:
		conn = mysql.connect()
		cursor = conn.cursor(pymysql.cursors.DictCursor)

		sql = "SELECT SUM(no_of_visits) total_visits, DATE(access_date) day_date FROM site_log WHERE DATE(access_date) >= %s AND DATE(access_date) <= %s GROUP BY DATE(access_date) ORDER BY DATE(access_date) DESC";

		param = (start_date, end_date)

		cursor.execute(sql, param)

		rows = cursor.fetchall()

		data = []

		for row in rows:
			data.append({'label':row['day_date'], 'value':int(row['total_visits'])})

		resp = jsonify(data)

		resp.status_code = 200

		return resp

	except Exception as e:
		print(e)

	finally:
		if cursor and conn:
			cursor.close()
			conn.close()

if __name__ == "__main__":
    app.run()
Template File
The template or view file is kept into templates directory. templates is the standard directory in Flask framework, where you need to put your view or template files.
Notice how do we include external static resources in flask based web application.
<!DOCTYPE html>
<html>
<head>
<meta charset="UTF-8">
<title>XChart Example using Python Flask MySQL AJAX jQuery</title>
<link type="text/css"  rel="stylesheet" href="{{ url_for('static', filename='css/charts/chart.css') }}"/>
<link type="text/css"  rel="stylesheet" href="{{ url_for('static', filename='css/charts/xcharts.min.css') }}"/>
<link type="text/css"  rel="stylesheet" href="{{ url_for('static', filename='css/charts/bootstrap.min.css') }}"/>
<link type="text/css"  rel="stylesheet" href="{{ url_for('static', filename='css/daterangepicker.css') }}"/>
<script src="https://code.jquery.com/jquery-3.4.1.min.js"></script>
<script src="https://code.jquery.com/ui/1.12.1/jquery-ui.min.js"></script>
<script src="{{ url_for('static', filename='js/charts/d3.v2.js') }}"></script>
<script src="{{ url_for('static', filename='js/charts/sugar.min.js') }}"></script>
<script src="{{ url_for('static', filename='js/charts/xcharts.min.js') }}"></script>
<script src="{{ url_for('static', filename='js/charts/script.js') }}"></script>
<script src="{{ url_for('static', filename='js/daterangepicker.js') }}"></script>
</head>
<body>
	<div style="margin: 10px 0 0 10px;">
		<h3>XChart Example using Python Flask MySQL AJAX jQuery</h3>

		<form class="form-horizontal">
			<fieldset>
			<div class="input-prepend">
				<span class="add-on"><i class="icon-calendar"></i></span>
				<input type="text" name="range" id="range" />
			</div>
			</fieldset>
		</form>

		<div id="msg"></div>

		<div id="placeholder">
			<figure id="chart"></figure>
		</div>
	</div>
</body>
</html>
Fetch Data using AJAX
We apply AJAX technique using jQuery to fetch data from MySQL database using Python and Flask as server side technologies.
The following code snippets are written into script.js file.
$.ajax({
	method: "POST",
	url: '/xchart',
	contentType: 'application/json;charset=UTF-8',
	data: JSON.stringify({'start': startDate.format('{yyyy}-{MM}-{dd}'), 'end': endDate.format('{yyyy}-{MM}-{dd}')}),
	dataType: "json",
	success: function(data) {
		if ((data.indexOf("No record found") > -1) || (data.indexOf("Date must be selected.") > -1)) {
			$('#msg').html('<span style="color:red;">' + data + '</span>');
			$('#placeholder').hide();
			chart.setData({
				"xScale": "time",
				"yScale": "linear",
				"main": [{
						className: ".stats",
						data: []
					}]
			});
		} else {
			$('#msg').empty();
			$('#placeholder').show();
			var set = [];
			$.each(data, function() {
				set.push({
					x: this.label,
					y: parseInt(this.value, 10)
				});
			});
			chart.setData({
				"xScale": "time",
				"yScale": "linear",
				"main": [{
						className: ".stats",
						data: set
					}]
			});
		}
	},
	error: function(err) {
		console.log(err);
	}
});
Testing the Application
Now navigate to the project root directory and execute the command python main.py or simply main.py, your server will be started on default port 5000.
If you want to change the port then you can change the line app.run() to app.run(port=5001), where 5001 is the new port.
Accessing home page using http://localhost:5000 will give you nothing displayed on the chart.
When you select data range as shown below you will see the following data on XChart:
That’s all.
Thanks for reading.