Access Endpoints via JMX
This tutorial will show you how to access Endpoints via JMX in Spring Boot Actuator. As you may know only /actuator/health and /actuator/info are accessible over HTTP protocol for security reasons. Therefore if you want to access other end points you have to access over JMX.
JMX console comes with the JDK installation, so you don’t have to install any special software. Below you will see how to start JMX (JConsole) and access Spring Boot end points, such as, /actuator/beans, /actuator/auditevents etc. over JMX.
Prerequisites
First go through the example Spring Boot Actuator – Production Ready Features
Before you make a connection to the J Console, make sure you add the following arguments as VM arguments in the Spring Boot application. This is required in order to make insecure connection because I am going to connect to local process.
-Dcom.sun.management.jmxremote
-Dcom.sun.management.jmxremote.ssl=false
-Dcom.sun.management.jmxremote.authenticate=false
By default JMX endpoints are not enabled, so you can do so by adding the following property to the application.properties file of your Spring Boot application:
spring.jmx.enabled = trueStarting JConsole (JMX)
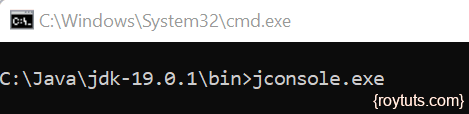
JMX (Java Monitoring and Management Console) can be found under JDK_HOME/bin directory. To start the Jconsole navigate to the directory JDK_HOME/bin and execute command jconsole.exe in command prompt as shown in the below image:
Once you execute the above command in command prompt, below popup opens:
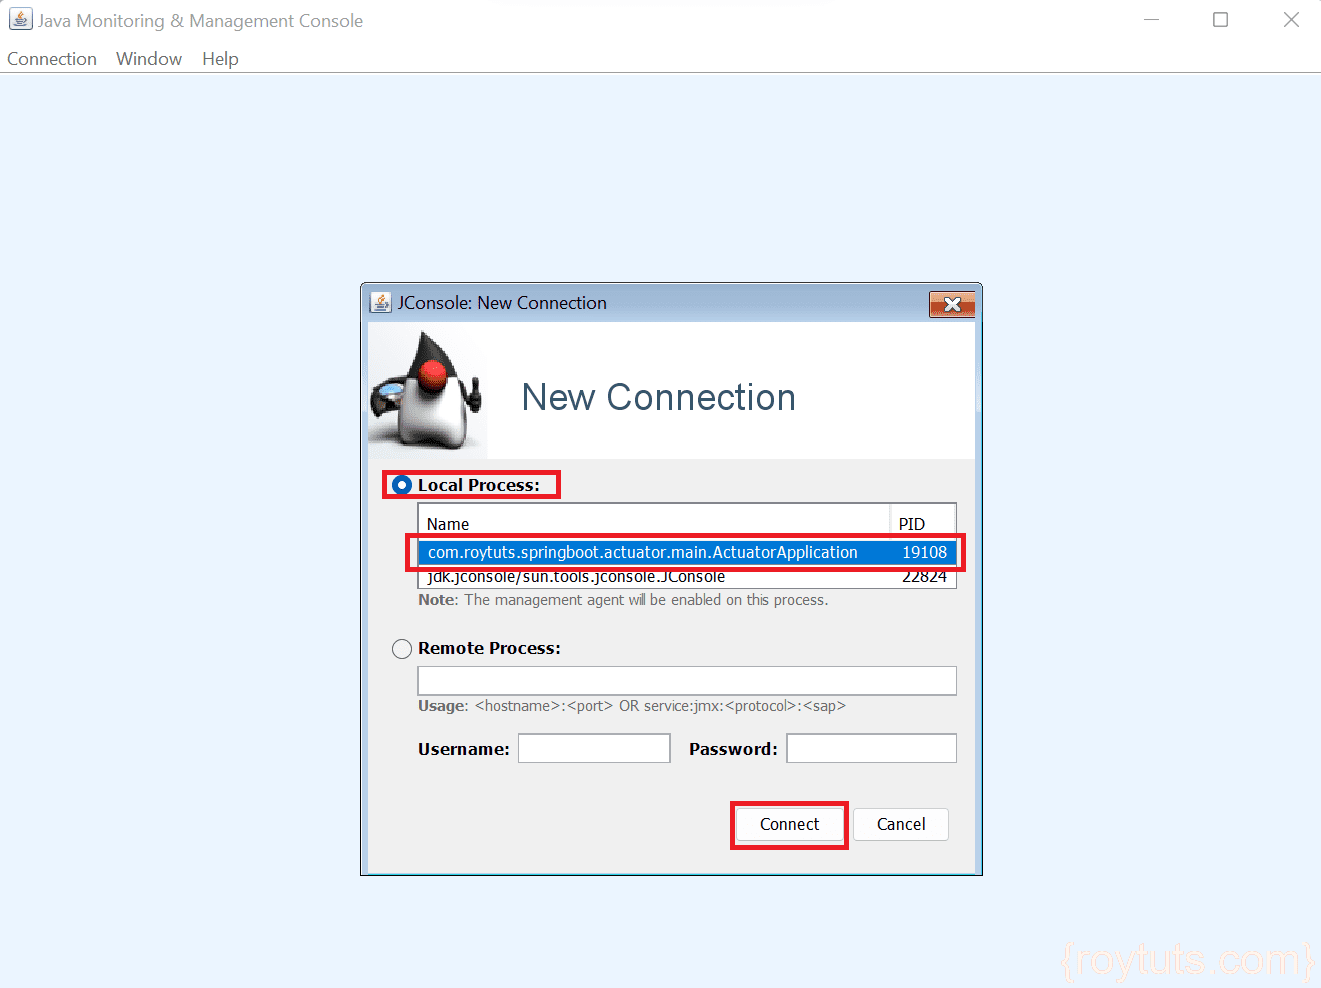
If the above main class with full package name is not shown under Local Process in the JConsole window then restart your spring boot application, then open a new connection from the menu Connection -> New Connection in the JConsole window.
Even if you are unable to find the desired class under the local process then you can check your hyperfdata_<username> folder under %temp% folder, for example, C:\Users\<user_name>\AppData\Local\Temp\<number>\hyperfdata_<username> whether a PID for your spring boot application has been generated or not. If not generated, you can delete this directory and restart your spring boot application. Then you can create a new connection.
Now select com.roytuts.springboot.actuator.main.ActuatorApplication under Local Process and click on Connect button.
If you face problem – Secure connection failed. Retry insecurely? as shown below in the image:
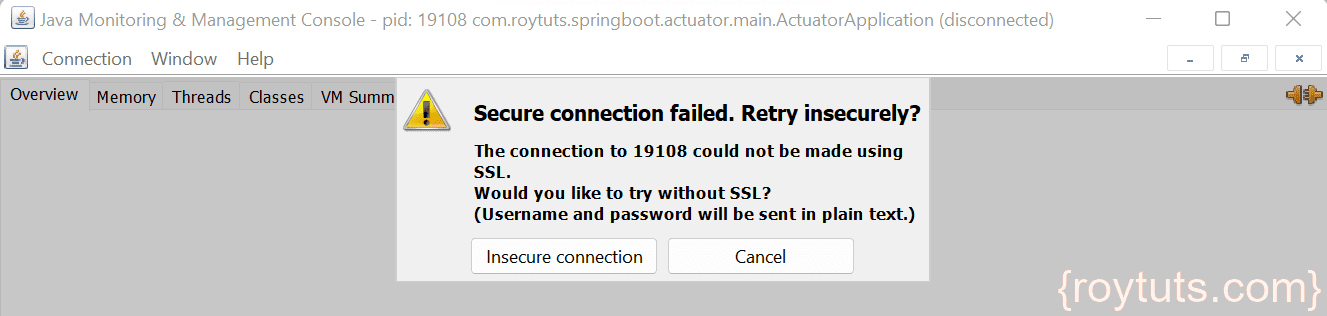
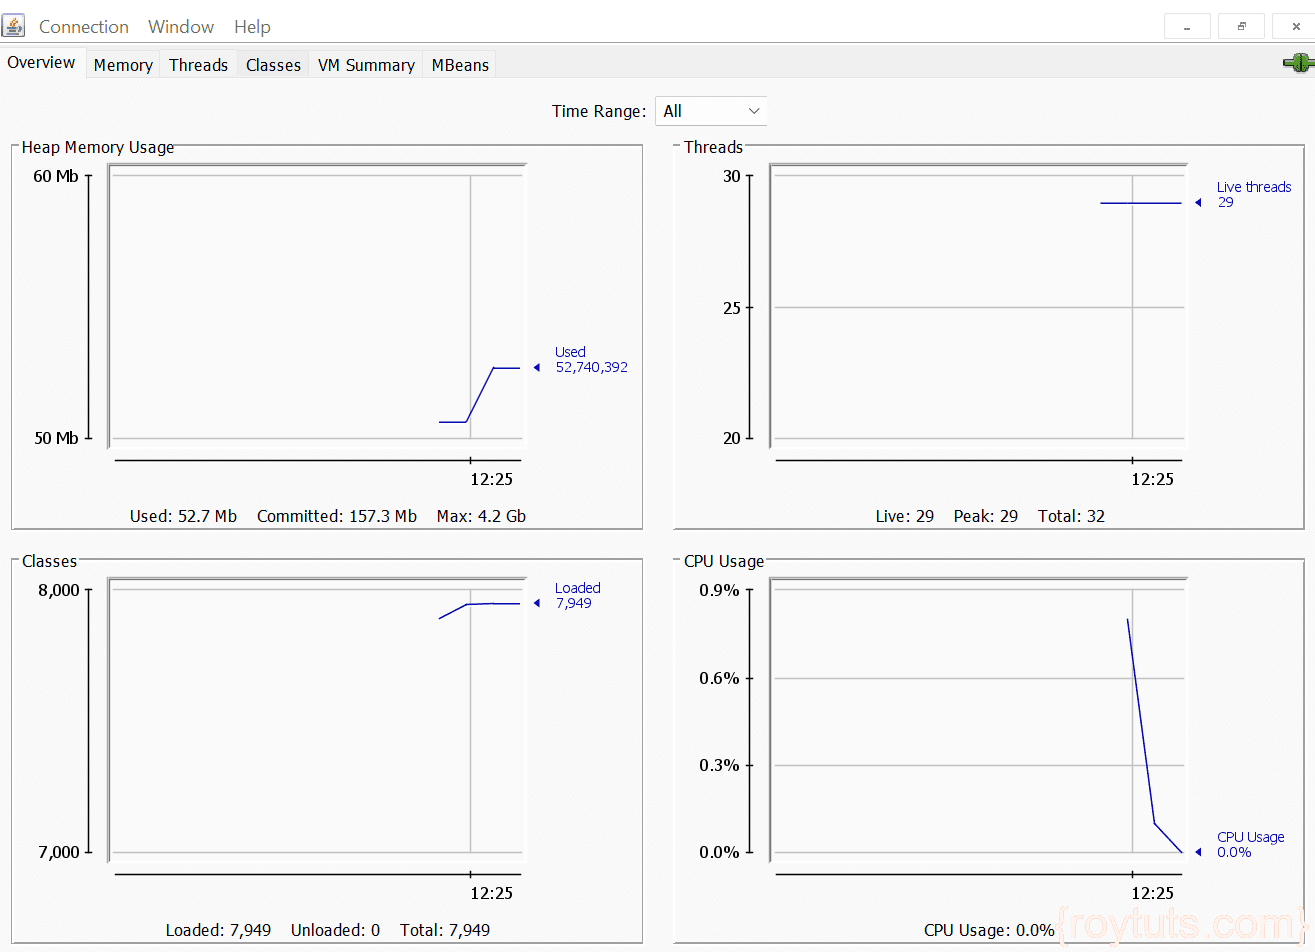
Then ignore the error and click on Insecure connection button to connect again. You will get to see similar to below window:
Accessing Endpoints via JMX
Now click on MBeans tab as shown in the below image and you will find the number of end points under package org.springframework.boot on left side tree.
By default Spring Boot exposes management endpoints as JMX MBeans under the org.springframework.boot domain.
You can also customize the JMX domain under which endpoints are exposed and the settings can be done in application.properties:
management.endpoints.jmx.domain=com.example.myapp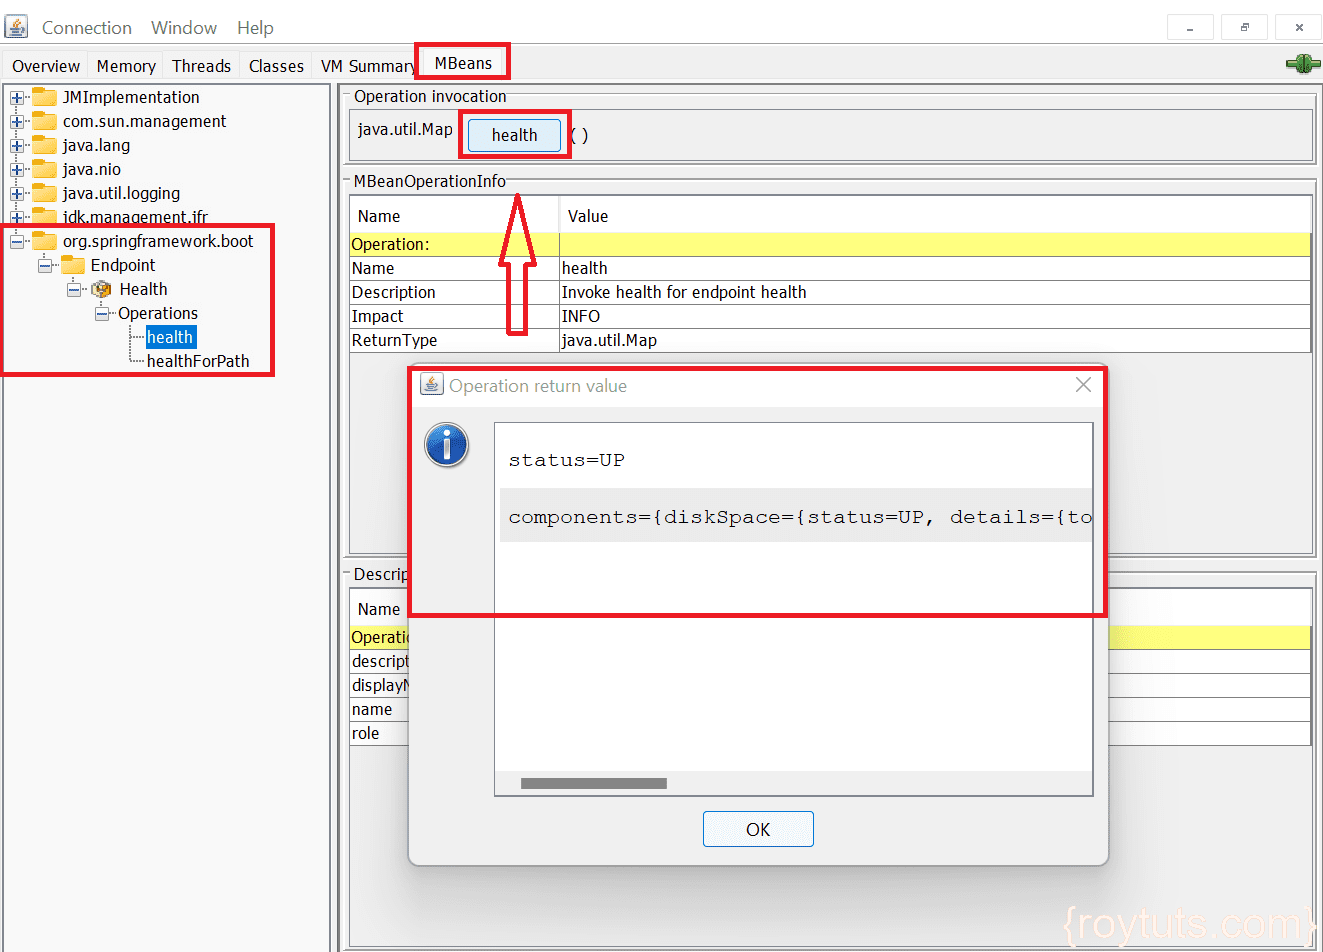
Now you can select endpoint on left side tree and check details for each endpoint on right side.
Let’s say you want to see the details for Health end point. So click on Health -> Operations -> Health on left tree.
Then you will find java.util.Map along with health button on top of Operation invocation window on right side.
If you click on health button then you will get a window called Operation return value as shown in the below image by arrow but you won’t be able to see details as it is a tiny window.
Therefore to see details about beans just select all inside the Operation return value window by pressing Ctrl+a from the keyboard and you can paste it into Notepad++ to see the details.
So here you have seen how to access a particular end point over JMX.
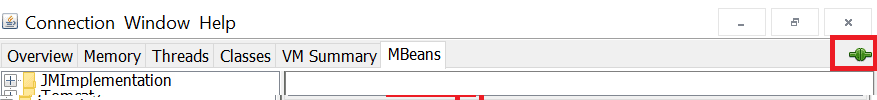
If you want to disconnect the JMX console, just click the green button as shown below image:
Hope you have got an idea how to use JConsole to access spring boot actuator endpoints.